Kubernetes安全之NPD
一 前言
在云原生时代,有大量的节点问题可能会影响节点上运行的 pod,例如:
- 基础设施守护进程问题:ntp 服务关闭;
- 硬件问题:CPU、内存或磁盘损坏;
- 内核问题:内核死锁、文件系统损坏;
- 容器运行时问题:无响应的运行时守护进程;
目前,这些问题对于集群管理堆栈中的上游层来说是不可见的,因此 Kubernetes 将继续将 Pod 调度到坏节点。
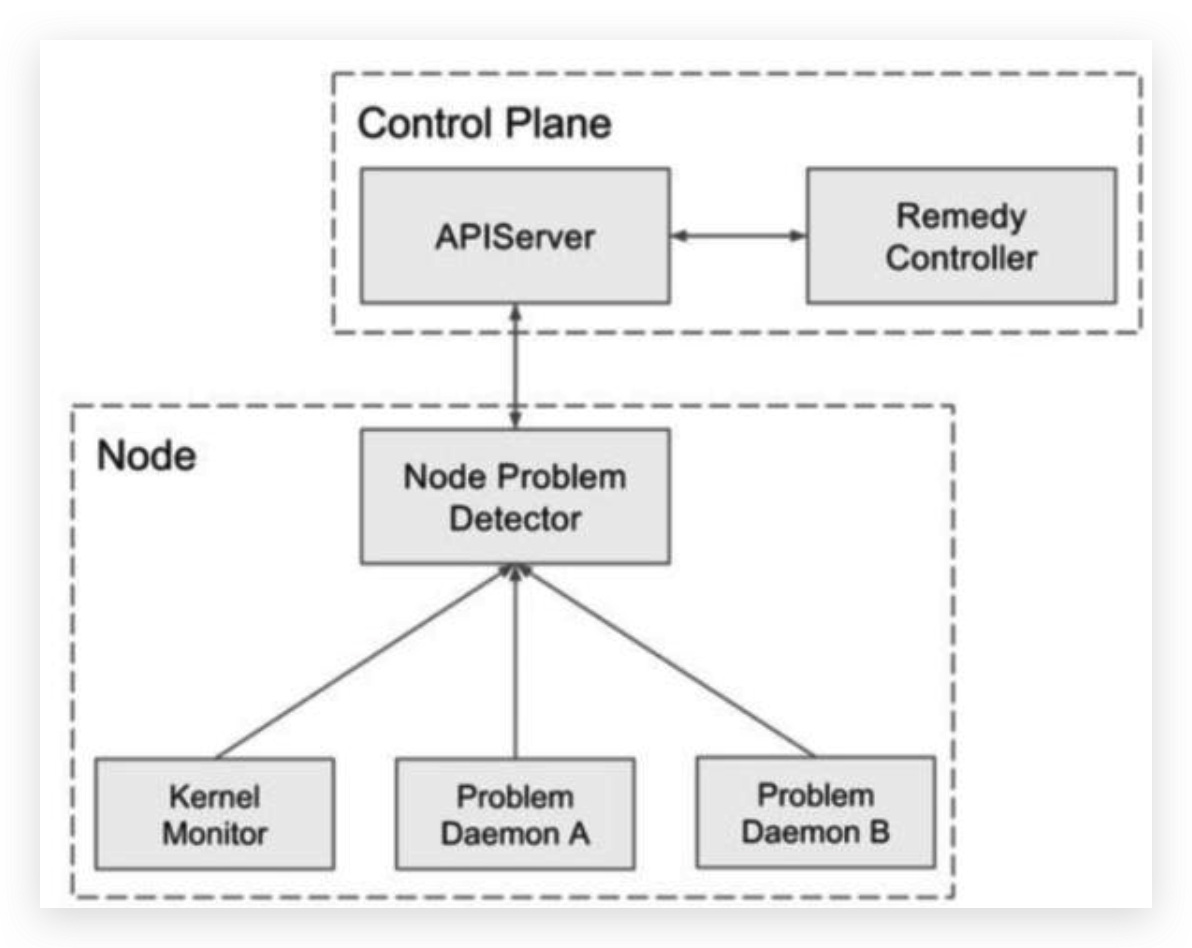
为了解决这个问题,我们引入了新的守护进程节点问题检测器,从各个守护进程中收集节点问题,并使它们对上行层可见。一旦上游层对这些问题有了可见性,我们就可以讨论补救系统。
Kubernetes 针对与部署的Node节点,需要有一款工具能够对齐进行持续性的检测,包括内核、内存、系统线程、文件系统描述符等,针对Node节点进行检测第一时间发现异常,以保障集群安全稳定。
二 node-problem-detector简介
2.1 NPD简介
节点问题检测器旨在使各种节点问题对集群管理堆栈的上行层可见。它是一个在每个节点上运行的守护进程,检测节点问题并将其报告给服务器。Node-problem-detector 既可以作为 DaemonSet 运行,也可以独立运行。现在它作为默认启用的 Kubernetes Addon 在 GCE 集群中运行。用于监视和报告节点的健康状况(包括内核死锁、OOM、系统线程数压力、系统文件描述符压力等指标)。 节点问题检测器从各种守护进程收集节点问题,并以NodeCondition和Event的形式报告给 API Server。
2.2 Problem API
node-problem-detector 使用 Event 和 NodeCondition 向 apiserver 报告问题。
- NodeCondition:使节点对 pod 不可用的永久性问题应报告为 NodeCondition。
- Event:对 pod 影响有限但提供信息的临时问题应报告为事件。
2.3 Problem 守护进程(Monitor)
Problem Daemon(在代码内部也叫Monitor)是NPD的子守护进程,每个PD监控一个特定类型的节点故障,并报告给NPD。目前PD以Goroutine的形式运行在NPD中,未来会支持在独立进程(容器)中运行并编排为一个Pod。在编译期间,可以通过相应的标记禁用每一类PD。
问题守护进程是 node-problem-detector 的子守护进程。它监视特定类型的节点问题并将它们报告给节点问题检测器。
问题守护进程可能是:
- 为专用 Kubernetes 用例设计的小型守护程序。
- 与 node-problem-detector 集成的现有节点健康监控守护程序。
目前,一个问题守护进程在 node-problem-detector 二进制文件中作为 goroutine 运行。未来,我们会将 node-problem-detector 和问题守护进程分离到不同的容器中,并按照 pod 规范组合它们。
通过设置相应的构建标记,可以在编译时禁用每一类问题守护进程。如果在编译时禁用它们,那么它们的所有构建依赖项、全局变量和后台 goroutine 都将从已编译的可执行文件中删除。
支持的问题守护进程类型列表:
| Problem Daemon Types | NodeCondition | Description | Configs | Disabling Build Tag |
| SystemLogMonitor | KernelDeadlock ReadonlyFilesystem FrequentKubeletRestart FrequentDockerRestart FrequentContainerdRestart | A system log monitor monitors system log and reports problems and metrics according to predefined rules. | filelog, kmsg, kernel abrt systemd | disable_system_log_monitor |
| SystemStatsMonitor | None(Could be added in the future) | A system stats monitor for node-problem-detector to collect various health-related system stats as metrics. See the proposal here. | disable_system_stats_monitor | |
| CustomPluginMonitor | On-demand(According to users configuration), existing example: NTPProblem | A custom plugin monitor for node-problem-detector to invoke and check various node problems with user-defined check scripts. See the proposal here. | example | disable_custom_plugin_monitor |
| HealthChecker | KubeletUnhealthy ContainerRuntimeUnhealthy | A health checker for node-problem-detector to check kubelet and container runtime health. | kubelet docker |
2.4 Exporter
导出器是节点问题检测器的一个组件。它向某些后端报告节点问题和/或指标。其中一些可以在编译时使用构建标签禁用。支持的出口商列表:
| Exporter | Description | Disabling Build Tag |
|---|---|---|
| Kubernetes exporter | Kubernetes exporter reports node problems to Kubernetes API server: temporary problems get reported as Events, and permanent problems get reported as Node Conditions. | |
| Prometheus exporter | Prometheus exporter reports node problems and metrics locally as Prometheus metrics | |
| Stackdriver exporter | Stackdriver exporter reports node problems and metrics to Stackdriver Monitoring API. | disable_stackdriver_exporter |
三 部署测试
3.1 集群内部署
利用helm进行部署,部署完成后可以看到npd是以daemonset方式存在,在每个节点上都有运行的具体pod。
$ helm repo add deliveryhero https://charts.deliveryhero.io/
$ helm install deliveryhero/node-problem-detector --generate-name
NAME: node-problem-detector-1646190796
LAST DEPLOYED: Wed Mar  2 11:13:20 2022
NAMESPACE: default
STATUS: deployed
REVISION: 1
TEST SUITE: None
NOTES:
To verify that the node-problem-detector pods have started, run:

  kubectl --namespace=default get pods -l "app.kubernetes.io/name=node-problem-detector,app.kubernetes.io/instance=node-problem-detector-1646190796"
3.2 单机独立部署
Node-problem-detector也可以直接独立启动,需要指定k8s-apiserver的地址以及配置inClusterConfig 为false,详细可以参考独立部署
四 配置参数
-
system-log-monitor相关参数 --config.system-log-monitor: system log monitor配置文件路径,多个文件用逗号分隔,如config/kernel-monitor.json,NPD会为每一个配置文件生成单独的log monitor。你可以使用不同的log monitors来监控不同的系统日志。
-
system-stats-monitor相关参数 --config.system-stats-monitor: system status monitor配置文件路径,多个文件用逗号分隔,如config/system-stats-monitor.json,NPD会为每一个配置文件生成单独的status monitor。你可以使用不同的status monitors来监控系统的不同状态。
-
custom-plugin-monitor相关参数 --config.custom-plugin-monitor:用户自定义插件配置文件路径,多个文件用逗号分隔,如config/custom-plugin-monitor.json,NPD会为每一个配置文件生成单独的自定义插件监视器。你可以使用不同的自定义插件监视器来监控不同的系统问题。
-
Kubernetes exporter相关参数 --enable-k8s-exporter:是否开启上报信息到API Server,默认为true--apiserver-override:一个URI参数,用于自定义node-problem-detector连接apiserver的地址。如果--enable-k8s-exporter为false,则忽略此内容。格式与Heapster的源标志相同。例如,要在没有身份验证的情况下运行,请使用以下配置:http://APISERVER_IP:APISERVER_ ... false 请参阅heapster文档以获取可用选项的完整列表。--address:绑定NPD服务器的地址。--port:NPD服务端口,如果为0,表示禁用NPD服务。
-
Prometheus exporter相关参数 --prometheus-address:绑定Prometheus抓取端点的地址,默认为127.0.0.1--prometheus-port:绑定Prometheus抓取端点的端口,默认为20257,使用0禁用
-
Stackdriver exporter相关参数 --exporter.stackdriver:Stackdriver exporter程序配置文件的路径,例如:config/exporter/stackdriver-exporter.json,默认为空字符串。 设置为空字符串以禁用。
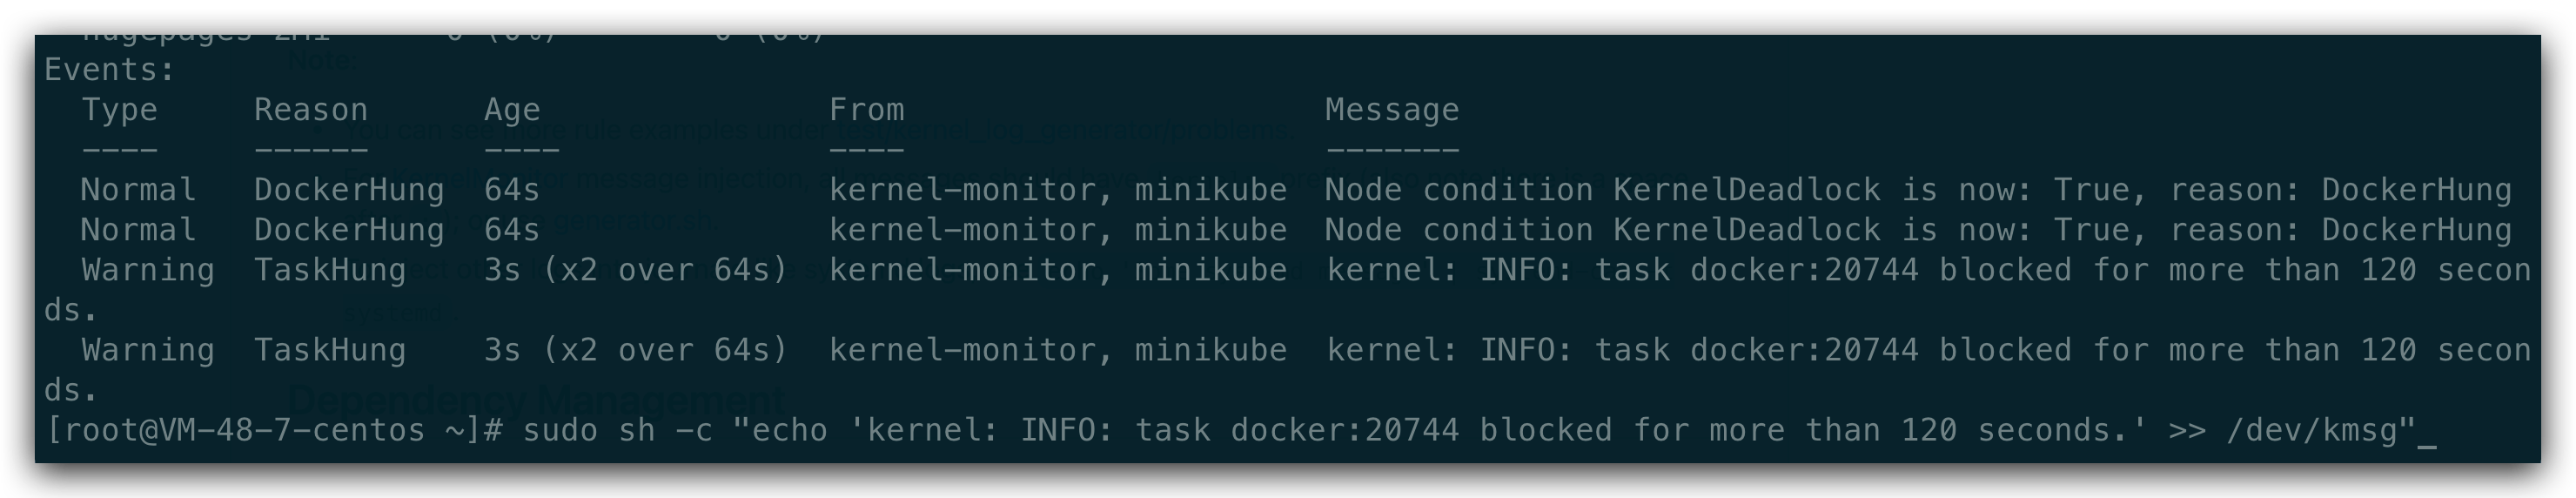
五 模拟测试
sudo sh -c "echo 'kernel: BUG: unable to handle kernel NULL pointer dereference at TESTING' >> /dev/kmsg"

六 其他
- 如果镜像拉取异常,可以尝试使用我的镜像:
- 通过自定义配置健康Node节点的规则,可以在K8s Api-server的事件中获取到具体的告警信息。
**node-problem-detector**是一个K8S加载项(Addon),目的是将节点故障暴露给集群管理的上层组件。NPD通常运行为DaemonSet,也可以作为独立进程运行。NPD会检测各种各样的节点问题,NodeCondition:当遇到永久性的节点故障,导致其不可用时,设置节点的NodeCondition,Event:可能对Pod产生影响的临时信息。